If you are new to programming world, then its possible that you may not have heard of debugger. Well, in this article I will explain OnlineGDB debugger usage in brief.
- What is Debugger?
In general, debugger is utility that runs target program in controlled environment where you can control execution of program and see the state of program when program is paused.
GDB is such debugger, which is used to debug C/C++ programs.
OnlineGDB provides an interface to use GDB in cloud environment from your browser. - How can I control execution of program?
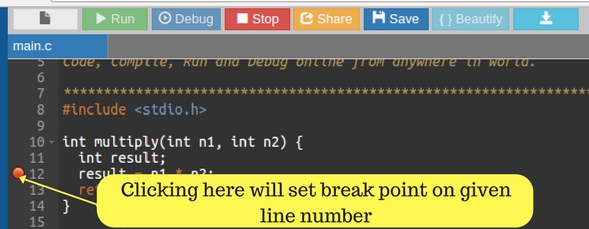
We can tell debugger when to pause a program by setting breakpoints.
To set a breakpoint, click on blank area seen on left side of line number in editor. When you click it, it should display red circle; which means breakpoint is set on that line number. Here is image of how it looks like.
You can set breakpoint via GDB console as well, more details you can find on this article.
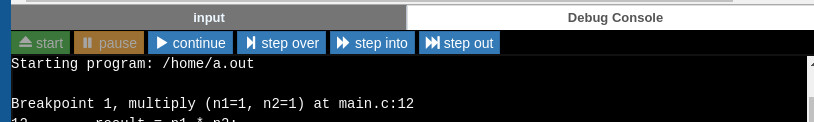
Once you set breakpoint, when you start program in debug mode, it will pause execution when program reaches the line where breakpoint is set.

Now we can use stepping commands to execute program line by line.
1. continue – Resume program execution until next breakpoint is reached
2. step into – Execute program line by line stepping into function
3. step over – Execute program line by line but don’t go inside function call
4. step out – Resume program execution until current function is finished
- What can I see when program is paused?
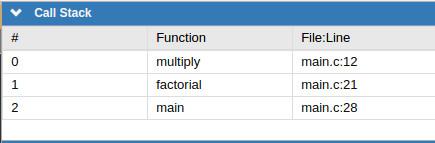
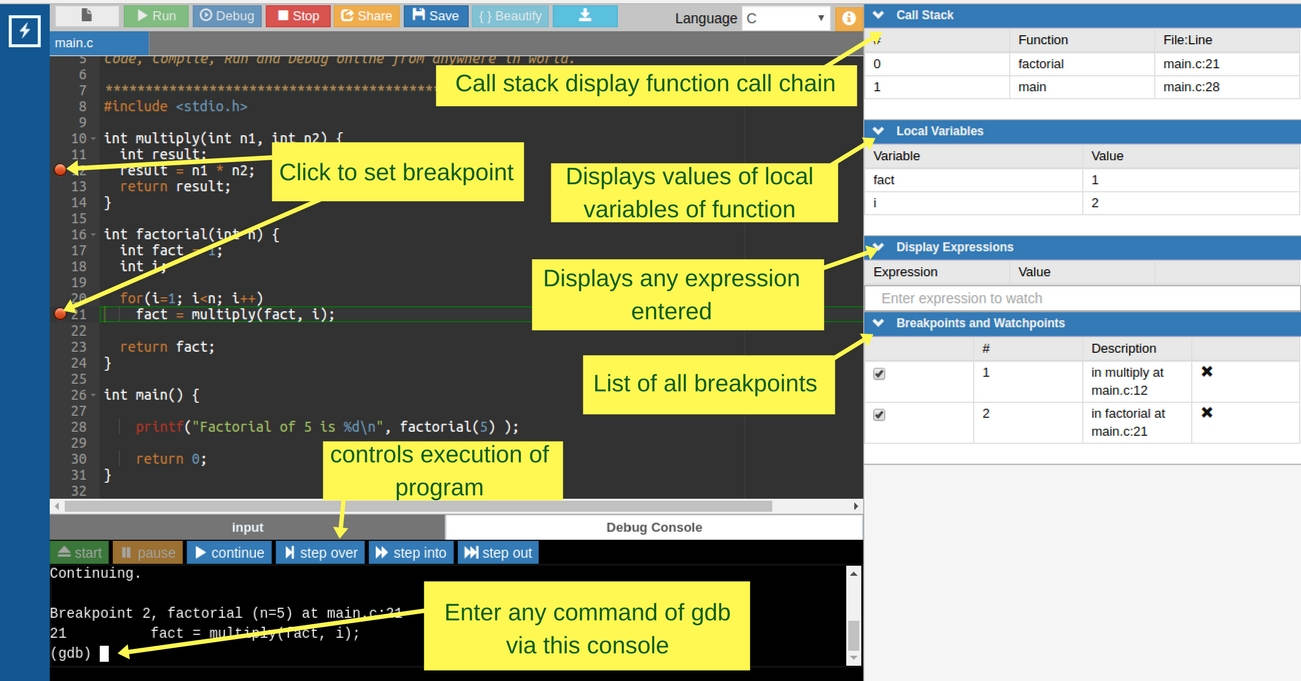
You can see call stack and values of local variables of current function.call stack shows you chain of function calls. As seen in below image, “main” function is calling function “factorial” and “factorial” is calling function “multiply”.
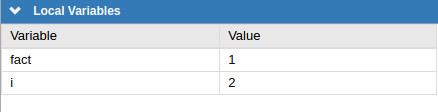
Local variables window shows you values of local variables of current function. As shown in image below, value of “fact” is 1, “i” is 1.
Here is single image depicting usage of OnlineGDB debugger.
Now we have control and eye on program execution, so we can inspect program execution flow. Breakpoints, stepping commands and variables displays are basic feature of debugger. In future, I will post more features helpful for debugging.
As shown in image below, value of “fact” is 1, and “i” is 2 instead of 1 .
In the image, execution is reached at line#21 but it hasn’t been executed yet. So value of “i” is 2. But “fact” is still 1. If we step/next from this line, then only “fact” value would have been updated.
how to give input in debug mode
When you run program in debug mode, console will pause for your input whenever your execution reach at input point. It is very much similar to the way you input in interactive run mode.
How can I input data interactively while in the debug mode!
When you run program in debug mode, console will pause for your input whenever your execution reach at input point. It is very much similar to the way you input in interactive run mode.