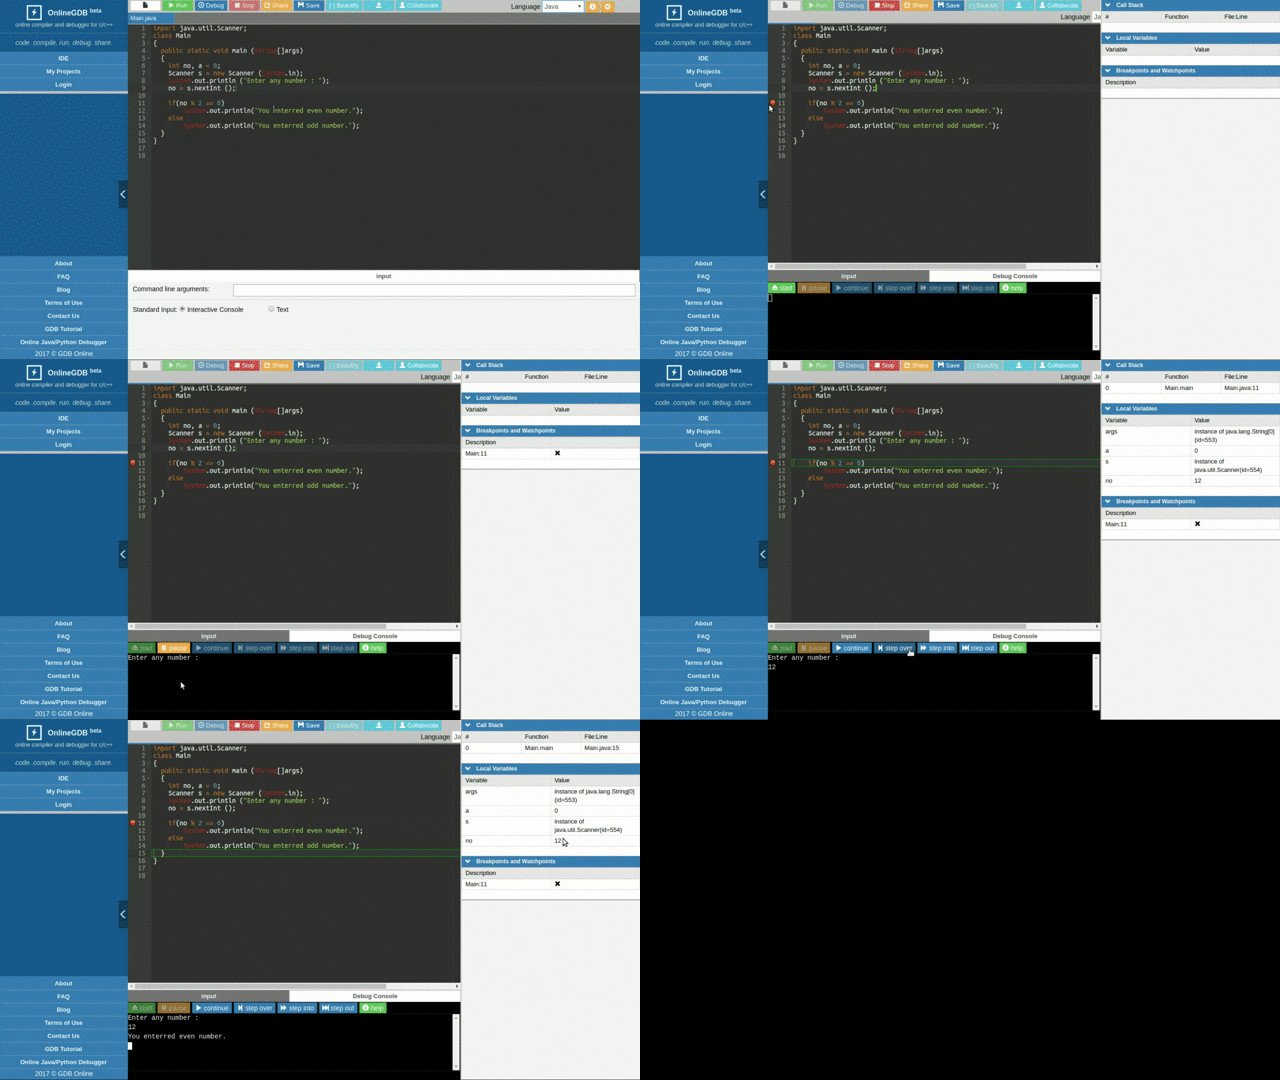
Every good programmer needs better tools and technology to ease out day to day programming work. Whether you are student or professional, debugger has been a key tool whenever you want to solve logical or run-time bug in your program. And hence OnlineGDB brings another key feature for java programmer by introducing java debugger mode.
How to start java program in debug mode?
Goto OnlineGDB IDE. Click on “Debug” button on top bar. And there you go, it will open debug interface and other helping windows (e.g. call stack, local variables, breakpoints)
What can I do in debug mode?
1. Set/clear breakpoints
2. Step by step execution of program
3. See local variables
In this article, you can get to know more about OnlineGDB debug interface.
Here is short demo of how to run java program in debug mode.
