Debugger always comes handy when you are writing complex program and you get stuck with logical bug in the program. Most programs scratch their mind when tracking bug. Sometimes its easy to catch problem sometimes it takes hours to figure it out. But if you know how to use debugger you can track the problem easily and quicker.
Having said that, We are glad to announce that now you can debug python program with OnlineGDB IDE. Some of python programmer would be knowing about PDB debugger module. We have built an easy to use web interface for debugging python program running under PDB debugger.
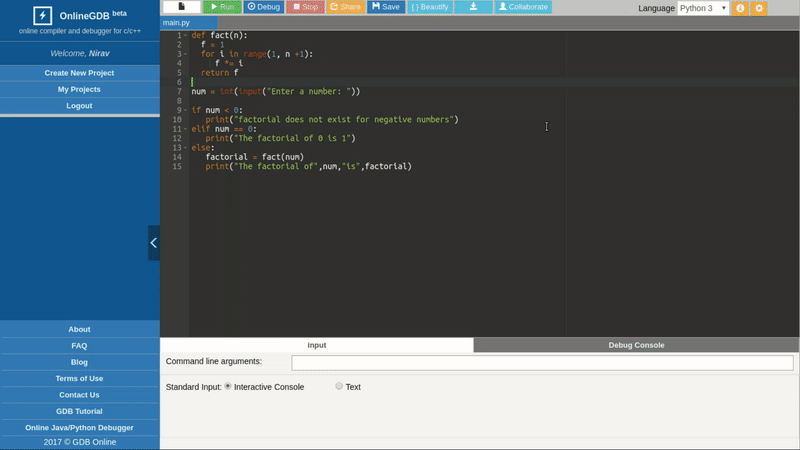
How to start python program in debug mode?
Goto OnlineGDB IDE. Click on “Debug” button on top bar. And there you go, it will open PDB debug console and other helping windows (e.g. call stack, local variables, breakpoints)
What can I do in debug mode?
1. Set/clear breakpoints
2. Step by step execution of program
3. See local variables
4. PDB console is available in debug mode, you can enter any pdb command in console
In this article, you can get to know more about OnlineGDB debug interface.
Here is short demo of how to run python program in debug mode.